Name: ________________________
Purpose:
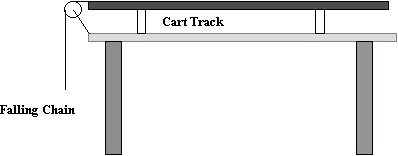
In this lab you will analyze the motion of a cart that is attached to a chain hanging from a pulley.
Procedure:
1. Set up the apparatus as illustrated above. Attach the chain to the dynamics cart and position the chain over the smart pulley so that the smart pulley rotates as the chain falls.
2. Load the Science Workshop program and install the smart pulley into the appropriate digital input. Have Science Workshop graph distance vs. time, velocity vs. time and acceleration vs. time.
3. Position the chain over the pulley so that the cart begins to move on its own.
4. Once the cart begins to move, begin recording data and stop as soon as the cart crashes into the pulley or the chain hits the floor.
5. Examine your data and determine what parts of your data coincide with the final crash and any interference at the beginning. Delete this data from your table and graphs and re-scale the graphs. (You may want help deciding what data to keep or delete)
Pre-Lab Questions:
1. What do you expect the graph of distance vs.
time to look like?
2. What do you expect the graph of velocity vs.
time to look like?
3. What do you expect the graph of acceleration
vs. time to look like?
4. Use the graph below to determine the distance
traveled between 2 and 5 seconds.
Data: Either print or copy into table form
the following table that should be on your screen in Science Workshop.
| Time (s) | Distance(m) | Velocity(m/s) | Acceleration(m/s/s) |
| . | . | . | . |
| . | . | . | . |
| . | . | . | . |
| . | . | . | . |
| . | . | . | . |
| . | . | . | . |
| . | . | . | . |
Analysis:
1. Print a copy of your distance vs. time, velocity vs. time and acceleration vs. time graphs.
2. Based on your prior knowledge, explain what is happening according to your distance vs. time graph.
3. Compare your velocity vs. time graph with the velocity vs. time graph you obtained from a cart traveling down an incline. How do these 2 graphs compare? Are they similar? Are they different? How are they different?
4. Compare your distance vs. time graph with the distance vs. time graph you obtained from a cart traveling down an incline. How do these 2 graphs compare? Are they similar? Are they different? How are they different?
5. Determine the distance traveled by the cart by calculating the area under the velocity vs. time graph as you did in the previous lab.
6 Contained in the Science Workshop
program, under the statistics function, is a tool called integration.
Integrate the velocity vs. time graph
and compare this number with the total distance traveled during the same
time frame as determined from the distance vs. time graph.
What do you notice about the integral of velocity vs. time and distance
traveled?
Post Lab Questions:
1. If you integrate something, what are you really
doing?
2. Can you tell if an object is accelerating at
a uniform or non-uniform rate from looking at the shape of a distance vs.
time graph?
3. Can you tell if an object is accelerating at
a uniform or non-uniform rate from looking at the shape of a velocity vs.
time graph?
4. Can you derive an algebraic equation to calculate
variables for a non-uniform accelerating object?