To determine the relationship between the linear velocity (v) and radial position (r) of a mass to its centripetal acceleration.

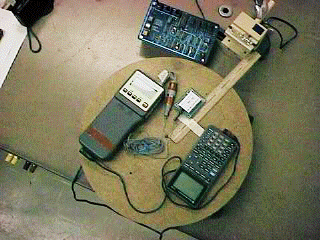
1. Set-up the experiment as represented in the photograph. The accelerometer serves as the rotating mass, and the ruler serves to provide a reference for the radius as well as a tab for the digital timer. The digital timer should be set at 01, in order to STOP ON A2. This will provide the period of the rotation.
2. Develop a data table that documents the radius, period, linear velocity, centripetal acceleration and linear acceleration of the accelerometer. You will need to document the linear velocity of the mass at various radius locations, and record the mean value of the accelerometer readings.
3. Fix the accelerometer at one radius position. Connect the CBL unit to the calculator and choose the program for ACCELERATION. Follow the instructions given by the calculator and proceed through until TRIGGER. Complete your data table for (at least) three different speeds of the turntable. In order to input the acceleration at each velocity, you must determine the mean value of the acceleration from the GRAPHICAL ANALYSIS graph.
4. Choose one of the velocities you have documented and achieve that same LINEAR VELOCITY for the mass at (at least) two other radius positions. Complete the data table for these positions.
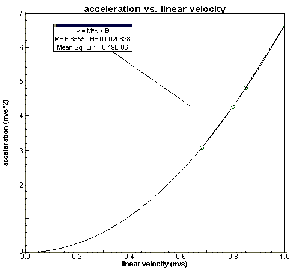
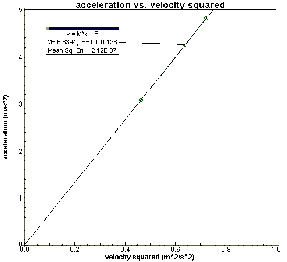
5. Using Graphical Analysis or Excel, graph the Acceleration vs. Velocity by using the data for the mass at the same radius. Determine the relationship between the two variables and write this as a proportion.
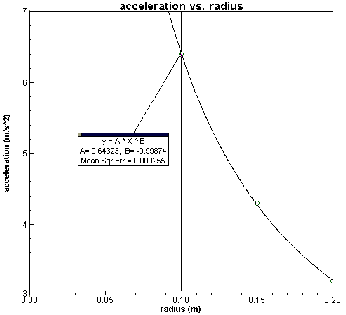
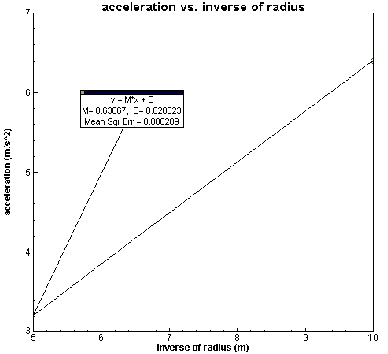
6. Graph the Acceleration vs. Radius by using the data where the velocity was the same. Determine the relationship between these two variables and write this as a proportion.
7. Using the information from the above two steps, develop an equation between the three variables. Present your support of this equation by using data in your table to prove whether or not it is valid.
Summarize the relationship between the variables.
This lab was developed as an exploration in order to provide the opportunity for "discovery" I had hoped that the data acquisition would be simple and of reasonable accuracy. Unfortunately, I could not iron out the problems I experienced. These problems were: the inaccuracy of the accelerometer, as well as the small velocity range of the turntable. Although the same velocity at various radius positions took some time to achieve, it was not problematic. By determining the desired period, I simply needed to achieve this by trial and error. I suggest using a source other than a turntable so that the variation and range of speeds is easier to achieve.
I have made graphs using false data in order to present the opportunities for analysis. These graphs are presented below. I would be very interested in suggestions from anyone regarding this lab.
Written by Linda Turner, July 1997