
Previously you have studied the Factor Effect and perhaps Characteristic Plot. Now we will look at a pattern from graphs that allows us to determine exactly what the nature of the relationship is.
Direct
Square
Inverse
Square Root
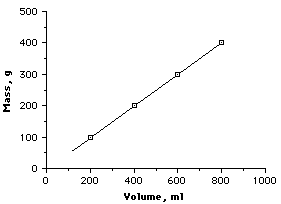 |
The characteristic plot for a Direct Relationship is a straight line graph. |
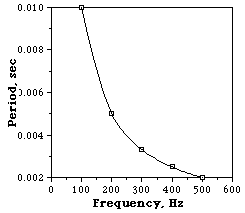 |
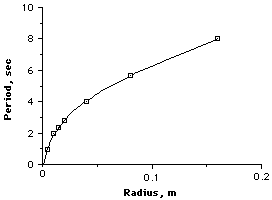
The normal plot of an Inverse Relationship gives a line which curves downward in a hyperbolic shape. |
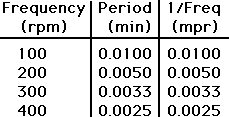 |
Now we recalculate the data table, finding the reciprocal of all the control values. Leave the dependent values alone. |
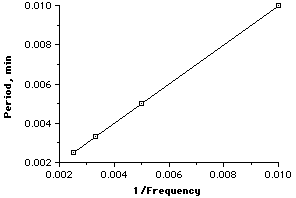 |
And when we re-plot the graph with the reciprocal of the control data, we get a straight line. Because the straight line resulted when we plotted the reciprocals of the control, this is proof of the Inverse Relationshiop. |
|
|
The general equation for a straight line is y = mx + b, where m is the slope and b is the intercept. If we have the straight line to the left, we get the equation: Period = m(1/Frequency) + b |
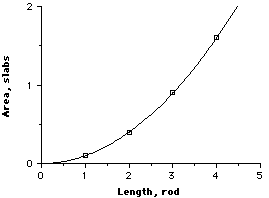 |
This graph is Characteristic of a Square Relationship. |
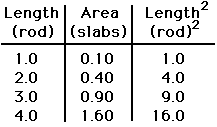 |
In a process similar to the proceeding one, the Squares of the Control Variable are first calculated, then plotted against the Dependent Variable. |
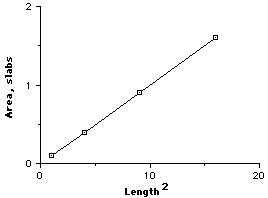 |
When the data for the control variable is squared and then plotted with the dependent variable, the result is a straight line. This is good proof that the original relationship was a Square Relationship. |
|
|
The general equation for a straight line is y = mx + b, where m is the slope and b is the intercept. If we have the straight line to the left, we get the equation: Period = m(Length2) + b |
 |
The graph shown here is characteristic of a Square Root relationship. |
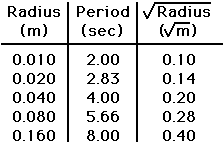 |
In this data table we take the square root of the control data values. Because there was an indication of a square root relationship was the clue that we should do this. |
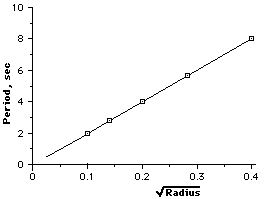 |
When the data from the Control variable is square rooted and then plotted versus the Dependent variable, the result is a straight line. This is good proof for a Square Root Relationship. |
|
|
The general equation for a straight line is y = mx + b, where m is the slope and b is the intercept. If we have the straight line to the left, we get the equation: Period = m(Length0.5) + b |
This may be the most powerful technique for determining the mathematical relationship. Mr. Bakken always says, "Happiness is a straight line." By this he means that if you have a straight line, you know the exact nature of the relationship. If you had to modify one or another of the axes in order to get the straight line, this only goes to show the exact nature of the relationship in the original data.Updated August 2001