 Infrared
Thermometer
Infrared
ThermometerHeat Conduction Experiment
Goals
- Gain experience using IRT
- Examine heat conduction in different materials
Materials
LabQuest
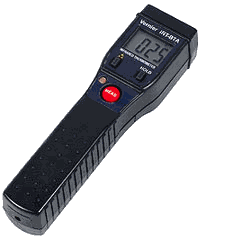
Infrared Thermometer
Data Collection Cable
Tennis Ball
Procedure
- In General: You will heat up an object or surface by rubbing it with a tennis ball then watch the surface cool off as the heat conducts away from the rubbed area. Compare the cooling rate for different surfaces.
- Plug the Infrared Thermometer (IRT) into the LabQuest using the Data Collection Cable that has a phone plug on one end and the BTA plug on the other.
- Start the LabQuest. Set up data collection for 2 samples per second for 60 seconds.
- Find a suitable surface and rub it vigorously with the tennis ball, heating it. Direct the IRT at the heated area and begin data collection. Direct the IRT at the same position until data collection times out.
- Tap the file cabinet icon to Store this run and get ready for a second run.
- Repeat the procedure for other surfaces, storing each but noting which surface was used for which run.
Analysis
- Display one run. Select a section of the graph where the temperature was dropping steadily. Select Graph > Analyze > Curve Fit > Temperature. Choose Linear from the drop-down menu. Note the equation that appears. The slope (m) is the cooling rate and should be in oC/s.
- Repeat the analysis for each of your samples, recording the rate for each.
- Explain why the surfaces with the highest rate had faster cooling than surfaces with the lower rate.
Data
|
|
oC/s |
|
|
|
|
|
|
|
|
|
Click here to download an MS Word version of this lab
Click here to download a pdf version of this lab
C.Bakken
6/2009