Resistors, Diodes & LED's - LQ

Introduction
The Vernier Power Amplifier (PAMP) is designed to boost signals from a LabQuest (LQ) or a LabPro for use in electronic and mechanical systems. It can amplify DC as well as several varieties of AC outputs and produce up to ±1 amp. This version of the lab will give specific instructions for using PAMP with a LabQuest and give a variety of investigations that can be done. This lab takes advantage of the application Power Amplifier built into LabQuest 1.3 or later.
When using the Power Amplifier with LabQuest, there will be a number of cords in use. The mini-phone cord, is used to send signals from LabQuest to PAMP. It connects into the headphone output on the side of LabQuest. The BTA-BTA cord connects between PAMP and one of the analog inputs on the LabQuest, allowing the LabQuest to monitor the current being produced by PAMP.
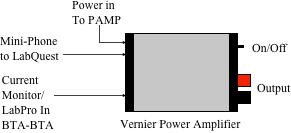
Signals processed by the Power Amplifier come out of the binding posts on the front. The black post is an electrical ground point and connects to ground in the LabQuest and ground in a ±10 V voltage probe.
Purpose
Study the behavior of different electrical devices in dynamic circuits.
Equipment
Vernier Power Amplifier, LabQuest, Voltage Probe (VP-BTA or DVP-BTA*), Resistors, Diode, LED’s. Light Bulb, Clip Leads
Procedure 1
-
1.Connect the cords between Power Amplifier and LabQuest as shown in the diagram that follows the lab. Connect your voltage probe to CH1 of the LabQuest. The lead colors in this and succeeding diagrams shows how to avoid ground problems when using VP-BTA.
-
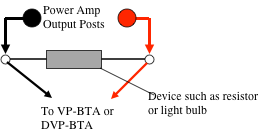
2.Connect the clip leads between the PAMP and the device as shown in this diagram, using a 330-ohm resistor as the device in the circuit:
-
3.Turn the Power Amplifier on using the switch at the front. Turn LabQuest on. On the Setup screen, you should see two quantities being measured, potential and current. Tap the Data Collection rectangle on the right side and set rate to 50 samples/s and length to 1 second.
-
4.Tap the Home icon then tap Power Amplifier. Set the waveform to sine, frequency to 2 Hz, and Amplitude to 3 volts. Tap the green box on the left to start the Power Amplifier.
-
5.Tap the Home icon again then tap LabQuest app. This returns you to the data collection program while the Power Amplifier is still running.
-
6.Initiate data collection. After the one second of data collection, you will see two graphs, potential (voltage) versus time and current versus time. How do the shapes of these two graphs compare? What does that indicate about the relationship between current and voltage?
-
7.Tap Graph > See Graph > Graph 1. This shows the potential versus time graph. Now tap on the x-axis label, and choose Current from the menu that appears. You will now have a graph of Potential versus Current. What is the shape of this graph? Does it confirm your thinking in step 6 above?
-
8.Tap Analyze > Curve Fit > Voltage. Choose Linear fit. From the analysis, what is the slope of the graph? Is this value related in any way to items in the experiment? You can go back to the graph screen by choosing OK or Cancel. Tap the file cabinet icon to store this run.
-
9.Change resistor value and repeat steps 6-8. Does this confirm your previous work? Make a general statement about the meaning of the slope on a Potential versus Current graph. Make a general statement about the shape of a Potential versus Current graph for a resistor. Compare the two graphs.
Procedure 2
-
10.Replace the resistor that you used in the previous steps with a flashlight bulb.
-
11.Tap on Home > Power Amplifier and change the frequency to 0.2 Hz, voltage to 3 V.
-
12.Tap on Home > LabQuest app and go back to the Setup screen. Tap on the Data Collection rectangle and change the rate to 20 samples/s and the length to 5 seconds.
-
13.Collect a fresh set of data with the light bulb. Change the graph to Potential versus Current. How does this graph compare with the one you obtained with a resistor? Does it tell you anything about the behavior of a hot light filament ?
-
14.Repeat steps 11-13, but increase the frequency to 2 Hz, the sampling rate to 50 samples/s, and the length to 1 second. How does changing the frequency change the shape of the graph? What is causing the change? How does the increased frequency affect the intensity of the light?
-
15.Repeat steps 11-13, but increase the frequency to 10 Hz, the sampling rate to 100 samples/s, and the length to 0.2 second. How does this change the shape of the graph? What is causing the change? How does the increased frequency affect the intensity of the light?
NOTE: Incandescent light bulbs are non-ohmic. From your experimentation, develop a meaning to this term and contrast that with what we mean when we say a device is ohmic.
Procedure 3
-
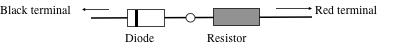
16.Replace the light bulb that you used in the previous steps with a diode. The diode should have a line around the body that’s nearer to one end than the other. When placing it in your circuit, put the end with the line closer to the lead coming from the black output terminal.
-
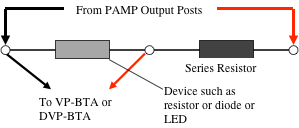
17.Connect a 330-ohm resistor in series with the diode for use in this lab. Connect the leads from your voltage probe across the diode as shown here:
-
18.Tap on Home > Power Amplifier. Set the waveform to sine, frequency to 2 Hz, voltage to 5 V. Make sure the Power Amplifier function is turned on.
-
19.Tap on Home > LabQuest app and go back to the Setup screen. Tap on the Data Collection rectangle and change the rate to 50 samples/s and the length to 1 seconds.
-
20.Collect a fresh set of data with the diode. Change the graphs to Voltage versus Current. Describe the graph you generated. Is the resistance of the diode constant like a resistor? Or does it resemble the light bulb? Describe the operation of the diode as well as you can.
-
21.Diodes are used to convert alternating current (think sine wave) into pulsing direct current, current that flows in only one direction. How does your graph show this?
-
22.Store the diode graph for future reference.
Procedure 4
-
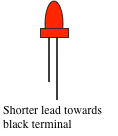
23.Replace the diode that you used in the previous steps with an LED, light emitting diode. LED’s typically have one lead shorter than the other. Place it closer to the black lead from the Power Amplifier like you placed the end of the diode with the line. When you connect it up, the LED should blink twice a second.
-
24.Collect a fresh set of data with the LED. Change the graphs to Potential versus Current. Describe the graph you generated. Does the graph resemble the graph from the diode? How are they the same and how are they different? You can plot both graphs together for easier comparison.
-
25.Store this graph, also, and change to a different color LED. How does the graph you obtain differ from the previous one? If you have a third LED, store the second and run a set of data for the third. Now compare all four diodes, but more particularly, the three LED’s. What changed as you moved from a red to yellow to green to blue LED? What changes as you move from red to yellow to green to blue light?
Analysis
-
1.Answer the questions in the lab procedure.
-
2.Determine the approximate resistance of your diode and LED’s when they were conducting current.
Extension:
This lab calls for using the sine wave function to drive the circuits. Do you get the same results with a ramp function or square wave function? Try it and try to determine why you either get the same or why you get different results with different waveforms.
Connection Diagram
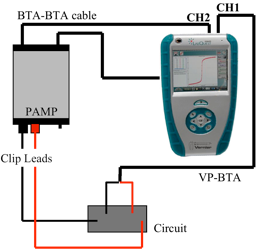
* Note: The two voltage probes sold by Vernier Software differ in one important characteristic. For VP-BTA, the ±10-volt voltage probe, the black lead is connected to electrical ground in the LabQuest. In this lab, it is also connected to the black output post on the Power Amplifier. On the other hand, for a DVP-BTA, the Differential Voltage Probe, the black lead is not connected to ground so the probe “floats” and measurements can be taken without worrying about ground connections.
Note: For blue or white LED’s, the Power Amplifier signal voltage may need to be higher than 5 volts.

Click here for MS Word version of this lab
Click here for MS Word version of this lab using LabQuest and Logger Pro
Clarence Bakken
Uploaded December 2009