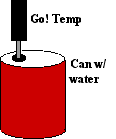
Cooling of objects takes place along their surface. An object with a larger surface area will lose heat faster than an object with smaller area. But larger objects have more mass and therefore more heat energy to release while cooling. Which of these two variables, surface area or mass, increases faster as objects grow in size?
Purpose
Compare the cooling rate for objects of different size.
Equipment
Go! Temp probe, Macintosh or PC Computer with Logger Lite, cans of similar shape but different size, hot water
Procedure
- Plug the Go! Temp probe into your computer then launch
Logger Lite software. When the software launches, it
will set up a graph of Temperature versus Time.
- Under Experiment in the menu bar select Data
Collection… Set the time for data collection to 600
seconds. A rate of 1 sample per second is a good rate for Go!
Temp. Click [Done] to set this new time.
- Heat water in a coffee maker or a microwave oven. When
handling the can once you’ve poured in the water, be
careful. Tongs should be used as the water may be close to
boiling! (Paper towels that are folded over can also be used to
protect your fingers.)

- Pour hot water into the can, filling it close to
overflowing. Place a Go! Temp probe as close to the center as
possible and hold it there. (You could use a ring stand to hold
the probes.) Wait approximately a minute for the probe to rise
to the temperature of the water. Press the green Collect button
to begin data collection.
- When data collection is complete, remove the Go! Temp probe
from the can. Dispose of the hot water carefully. Return the
can to the place indicated by the instructor and obtain a
second can that is a different size. This will be used for your
second run. Complete Analysis steps 1 and 2.
- Click the Store button (file cabinet). This leaves the
graph you just obtained on the screen while allowing you to
make a second run.
- Fill your second can with hot water. Repeat Step 5. A second graph line should appear, but it may start out higher or lower than your first trial. Complete the remaining Analysis questions.
Analysis
- Click on the Scale button (the large capital A). This
enlarges or shrinks the graph so that the graph line occupies
the most space on the screen. Go to the column in the computer
data table labled "Temp 1". Double-click on this space. When
the dialog box appears, change the name to "Large Can" with a
short name of "large" or "Small Can" and "small". This will
help you sort out results later.
- Did the can cool at a steady rate? Did it cool fastest at
the beginning or at the end? How did you determine your answer?
(The pattern may be clearer with the graph from the smaller
can.)
- Compare the graphs from your two cans. Which cooled the
fastest? Which cooled slowest? How did you determine this from
your graph? In the Data Table below, record either faster or
slower for the Cooling Rate of each can.
- Formulate a reason why you think one cooled faster than the other. Think of other situations where objects cool (or heat) fast or slow depending solely on their size. Explain these situations as part of your report.
Data Table