INTRODUCTION
 A number of amusement park rides with various names
are derived from the original “Enterprise”. The photo to the right
shows a view of the ride in operation.
A number of amusement park rides with various names
are derived from the original “Enterprise”. The photo to the right
shows a view of the ride in operation. Passengers get into the cars a short distance above the ground, with the main portion of the ride mechanism horizontal to the ground. The ride begins rotating faster and faster and the cars move outward, almost reaching horizontal. Why?
When the ride reaches its maximum speed, the whole ride lifts up and the riders go into circular paths around the center that becomes closer and closer to a vertical circle. After reaching the highest angle, the ride returns to level and the brakes are applied to end the experience.
In this lab, our initial interest is in examining the accelerations when the ride is in a horizontal plane and then a vertical plane. Other research questions follow and can be explored as time permits.
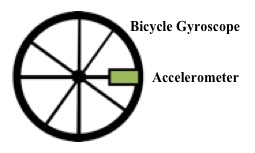
Figure 1
OBJECTIVES
* Examine the forces felt by riders on an amusement park ride known as “Enterprise” while it is rotating in a horizontal plane
* Compare the forces felt as Enterprise tilts up towards a vertical path
MATERIALS
Chromebook, computer, or mobile device
Graphical Analysis 4 app
GDX-Acc sensor
Bicycle Gyroscope
PROCEDURE
1. Attach the accelerometer to your bicycle gyroscope with the body aligned along a radius. (A regular bicycle wheel could be used with some care in making sure the accelerometer doesn’t hit the forks as the wheel rotates.) A good practice is to apply a counterweight at the same radius on the other side of the axle.2. Measure the radius of the accelerometer cell that lies just beneath the x-y-z axis diagram and record in your data table.
3. Launch Graphical Analysis. Connect and set up the GDX-ACC for your Chromebook, computer or mobile device:
a. Click or tap on New Experiment. Choose Wireless Devices.4. Place the gyroscope wheel so it revolves with the accelerometer in a level plane. Give the wheel a gentle push so it rotates approximately once every 2 to 3 seconds. Click or tap Collect to start data collection. After you have accumulated several rotations of the wheel, click or tap Stop to conclude data collection. If the time you set runs out the collection will stop by itself.
b. Click or tap on your accelerometer such as GDX-ACC.
c. Click or tap on the circled “i” for sensor information.
d. Click or tap on Sensors, then the “+” in front of Z-axis gyro to add this to X-axis acceleration.
e. Go back to Device > Wireless Devices > Done. You should now be in the graph display screen.
f. Click or tap on the X-axis acceleration icon at the bottom of the graph screen. With the accelerometer held in a horizontal position, press Zero. to set the value in this position to 0 m/s2. Repeat the process for the Z-axis gyro.
g. Data collection is set to end after 60 seconds. This is way too long. Click or tap on Mode and set a time that works for you like perhaps 6 s.
h. Finally, click or tap on the display icon to set the display to 1 Graph.
i. Click or tap on Done. You are now set to carry out this exploration.
5. Study your graphs to determine if the run was useful. You should see clearly the acceleration vs. time graph as the accelerometer moved around in its circular path.
a. Click or tap and drag across a portion of the graph involving 3-4 cycles of motion. Use the Graph Tools button to then choose View Statistics. What is the average value of the acceleration?7. Repeat as requested by your instructor with different angular speeds.
b. Click or tap on the vertical axis label, and change to x-angular velocity. Uncheck the x-axis acceleration graph. What is the average value of the angular velocity w?
c. The linear acceleration is given by Rw2, where R is the radius of the motion. Do this calculation and compare your answer to the value determined in 6a.
8. Change the orientation of the bicycle gyroscope so the rotation is in a vertical plane. Collect data for 5-6 rotations, then conduct these analysis steps.
a. Click or tap and drag across a portion of the graph involving 3-4 cycles of motion. Use the Graph Tools button to then choose View Statistics. What is the average value of the acceleration at the top of the motion? What is the average value at the bottom of the motion?
b. Show algebraically that the difference in acceleration at the top and bottom should just be equal to twice the acceleration due to gravity, 2g.
c. Test the theory using data you gathered in this step. Repeat with different angular speeds as requested.
DATA TABLES
| Radius of accelerometer" |
Horizontal Trial |
Average acceleration a (m/s2) |
Angular velocity w (rad/s) |
Calculated acceleration w2/R (m/s2) |
Percentage difference |
| 1 |
||||
| 2 |
||||
| 3 |
Vertical Trial |
Acceleration at top atop (m/s2) |
Acceleration at bottom abot (m/s2) |
Acceleration difference Da (m/s2) |
Compare to gravity |
| 1 |
||||
| 2 |
||||
| 3 |