Speed and velocity are rates. They tell us how much distance is covered in a unit of time. Velocity can be expressed by the formulav = d/t where v = velocity or speed, d = distance traveled, and t = time. In this experiment, you will study the velocity of a toy car. A Motion Detector will be used to record the motion and software will be used to determine the velocity.
OBJECTIVES
In this experiment, you will
- Measure speed using a Motion Detector
- Calculate average speeds
MATERIALS
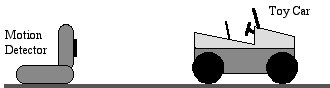
Computer, graphing calculator or LabQuest; data collection software; interface as needed, Motion Detector or Go! Motion; Toy Car
PROCEDURE
1. Prepare the equipment.
- Clear a space approximately 2-3 meters long with no impediments in the way for your toy car to move.
- Connect the Motion Detector to your data collection device.
- Launch your data collection program (Logger Lite*, Logger Pro, EasyData or LabQuest app.).
2. The default file for motion data is 20 samples/s for 5 seconds. This should work well for your experiment.
3. Collect data.
- Position your car with its back end approximately 20 cm from the Motion Detector (50 cm if your Motion Detector is blue). Start the motor, but don’t set it down, yet.
- Start data collection.
- Set the car down and release it after you hear a clicking sound coming from the Motion Detector.
- When data collection has ended or the car has gone out of sight of the detector, stop collecting data.
- If you need to take an extra run to get better data, do so at this time.
4. Determine where on your graph the car was going a constant speed. Select this portion of the graph for study.
- Do a linear fit for this graph section. Record the value of the slope and its units which is the speed of your car.
- Go to the Analysis section and complete steps 1-4.
5. Repeat Procedure steps 3-4 above to verify your results from the first run.
6. Repeat Steps 3-4 above with a different toy car. Compare the speeds of the two cars.
DATA
|
|
|
|
|
|
y = mx + b |
|
|
|
|
m (slope) |
|
|
|
|
average speed |
|
|
|
ANALYSIS1. Change the graph display to a velocity vs. time graph.2. Determine which section of this graph corresponds to your car going at a constant speed and select it. Now find the Statistics for this section. From the information that is given, what is the average speed of your car. Record that value in the data table.
3. Compare the value you obtained by taking the slope of the position vs. time graph with the average value of the velocity vs. time graph. How close are these two values? Are they close, or are they quite different?
4. Go on to the next step in the procedure.
5. Write a short summary of this lab, indicating two different ways to determine the speed of an object using the data collection equipment you have been using.
* You will need at least Logger Lite 1.4 in order to do the linear curve fit.Teachers may need to add extra steps of instructions depending on the specific equipment and software students are using in this lab. Details have been left out to make it a more general, inquiry-type lab.
This lab is modified from one appearing in the Real World Math with Computers lab manual.
MS Word version - HowFast.doc
pdf version - HowFast.pdf
Clarence Bakken
updated June 2008