|
|

Introduction
A "Popper" is a toy that consists
essentially of half a handball/raquetball. Users "invert" the
Popper by pressing on the top, then place it upside down on a
surface. As the Popper returns to it's normal shape, it exerts a
force on the surface which then exerts an equal and opposite
force on the Popper. This force pushes the Popper upward and
launches it into the air.
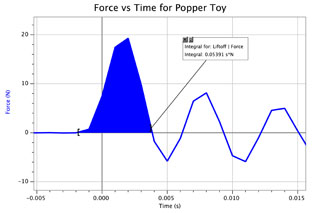
In this experiment you will investigate and characterize the force that a Popper makes on the surface as it lifts off. Using the data you obtain, you will work with additional concepts including impulse, momentum, kinetic and potential energy.
In this experiment you will investigate and characterize the force that a Popper makes on the surface as it lifts off. Using the data you obtain, you will work with additional concepts including impulse, momentum, kinetic and potential energy.
Materials
- Vernier Dual-Range Force Sensor (DFS-BTA), Vernier computer interface*, Wood platform, Popper(s)
* Appropriate interfaces include
LabPro, LabQuest Mini, LabQuest 1 and 2, and Go! Link
Preparing for Data Collection
 Remove the hook in the end
of the force sensor. You'll find the thread is a standard one
(6-32). Cut a square piece of wood (or plywood) that's a bit
bigger than the popper and drill a hole in the center that
will allow a 6-32 bolt to go through. Fasten the wood platform
to the sensor, then remove the thumb screw on the other end of
the force sensor, the one that can be used to hold it to a
ring stand.
Remove the hook in the end
of the force sensor. You'll find the thread is a standard one
(6-32). Cut a square piece of wood (or plywood) that's a bit
bigger than the popper and drill a hole in the center that
will allow a 6-32 bolt to go through. Fasten the wood platform
to the sensor, then remove the thumb screw on the other end of
the force sensor, the one that can be used to hold it to a
ring stand.
- Set the force sensor to the 50-N setting. Plug the interface
into the computer, connect the force sensor to one of the
analog inputs, and launch Logger Pro. Set up an experiment
file with a high collection rate (≥ 200 samples/s), but a
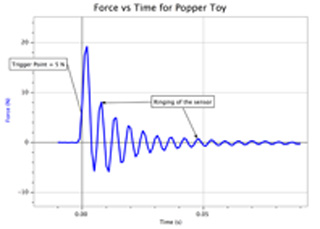
short collection time (0.1 second). Enable triggering and set
it so collection starts when the force exceeds a minimum value
of 5 N. Also collect 10 samples before triggering. Save this
file so you can make changes as needed to fine tune it and so
you can use it again next time.
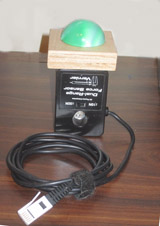
- In practice, you'll hold the end of the force sensor firmly against the table with the wood platform on top as shown in the diagram to the right. Go to Experiment > Calibrate Sensor > Dual-Range Force Sensor. With nothing on the platform, set the value to "0" N and click on "Keep" when the voltage is stable. Put a 500-g mass on the platform, enter "4.9" N and click on "Keep" when the voltage is stable. Indicate [Done] at this point. Set the popper on top of the platform, then zero the force reading. Measure and record the mass of the Popper in the Data Table that follows.