- Keep the distance between light source and sensor constant
- Correct for background light (Use zero function)
- Change one variable at a time - same power rating, different technologies or same technology, different power ratings
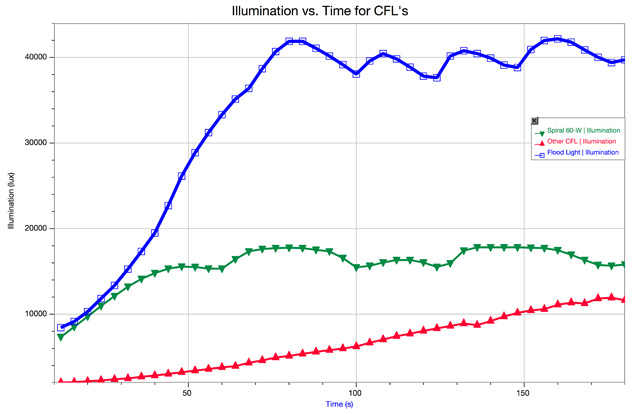
- Consider looking at each source over period of time to see if variations occur. If they do, use statistics function to determine average value and use that in data table.
- Don't be limited in thinking. A wide variety of lighting styles and types exist and they are rapidly expanding. To get a whole class project going, start by paying visit (or having students pay visit) to local lighting store or building supply store that carries a wide variety of lights. Then decide how to divide up the task.
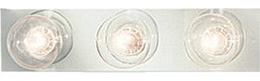
There is an initial cost to obtaining lights and the sensors, but they can be used many times. A light bar as illustrated can be obtained for a little over $10. The power cord would cost only a few dollars to connect. Or single light sockets can be obtained for a few dollars.
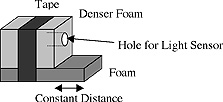
One possible Light Sensor Holder is shown here. By using higher density foam, it can be drilled out to hold the Light Sensor. The extra "foot" on the base provides for a constant distance from the light bar for making measurements. You may wish to use this or simply a ring stand to hold the Light Sensor.
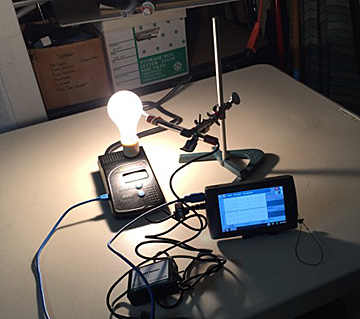
Here is a photo taken while gathering data:
A bathroom light bar could be purchased from the local building supply company for under $20. This gives several light sockets and a convenient way of wiring in a power cord while not taking up too much room in the supply room. One is shown here for example. This would be a good way to set up a demonstration if the teacher chose to do a demonstration rather than having the class do a lab.