OBJECTIVES
In this experiment, you will
* Measure ground and air
temperatures at various locations.
* Measure reflected light intensity at various locations.
* Record the GPS coordinates of the locations as these measurements are taken.
* Determine if there are temperature differences between the ground and air above it.
* Organize and present your results.
* Measure reflected light intensity at various locations.
* Record the GPS coordinates of the locations as these measurements are taken.
* Determine if there are temperature differences between the ground and air above it.
* Organize and present your results.
MATERIALS
| LabQuest 2 or LabQuest 1
w/ VGPS |
Temperature Probe |
| Infrared Thermometer |
several rubber bands |
| LabQuest app |
Light Sensor |
| meter stick or ruler |
PROCEDURE
Part I Planning Data Collection
1. Make a sketch of the school
grounds including details such as different surfaces, trees,
etc.
2. Plan the locations where you wish to collect your data and indicate them on your sketch.
Part II Measuring
Temperatures and Reflected Light Intensity2. Plan the locations where you wish to collect your data and indicate them on your sketch.
3. For LabQuest
2, tap File > New.
Set up the GPS sensor by tapping Sensor > Sensor Setup. Tap the box next to GPS to set up that sensor.
3a. For LabQuest 1, plugging in the Vernier GPS sensor initiates collection of GPS data. You don’t have to set up like you do LabQuest 2.
4. If your Light Sensor has a switch, set it to 150,000 lux. Connect the Light Sensor, Temperature Probe and Infrared Thermometer to the analog inputs to your LabQuest 2. If you have older sensors that do not auto-ID, manually set up the sensors.
5. Note: If there is direct sunlight on the temperature probe tip during data collection, the readings will be too high. To prevent this, use your hand to shade the tip of the probe.
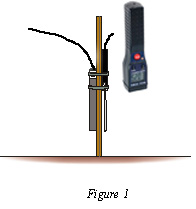 6.
Fasten the Light Sensor to a meter stick using two rubber bands
as shown in Figure 1. Slide the Temperature Probe under the
rubber bands on the other side of the ruler as shown in Figure
1. Both probe tips should be at the 5 cm mark.
6.
Fasten the Light Sensor to a meter stick using two rubber bands
as shown in Figure 1. Slide the Temperature Probe under the
rubber bands on the other side of the ruler as shown in Figure
1. Both probe tips should be at the 5 cm mark.
7. Note that Data Collection has been set to Selected Events. After you begin data collection, each time you tap the KEEP icon, a set of data will be recorded for that location.
8. Move to the first location you planned to take measurements. Initiate data collection by tapping the Collect icon or pressing the Collect button. Position the meter stick so the temperature probe is shielded from the sun, the light sensor is pointed straight down, and the Infrared Thermometer is pointed straight down. Tap the KEEP icon to record your measurements. Do not stop data collection until you are finished with step 9.
9. Move to the next location, arrange your sensors, tap KEEP. Continue until you have collected data at all of the locations you planned. Then tap the Collect icon or button to stop data collection.
10. Go to the Data Table and record the data from six of your locations in the table below. Include descriptions of those locations from your sketch. The Infrared Thermometer reading is the surface temperature while the temperature probe recorded the 5-cm reading.
3a. For LabQuest 1, plugging in the Vernier GPS sensor initiates collection of GPS data. You don’t have to set up like you do LabQuest 2.
4. If your Light Sensor has a switch, set it to 150,000 lux. Connect the Light Sensor, Temperature Probe and Infrared Thermometer to the analog inputs to your LabQuest 2. If you have older sensors that do not auto-ID, manually set up the sensors.
5. Note: If there is direct sunlight on the temperature probe tip during data collection, the readings will be too high. To prevent this, use your hand to shade the tip of the probe.
6.
Fasten the Light Sensor to a meter stick using two rubber bands
as shown in Figure 1. Slide the Temperature Probe under the
rubber bands on the other side of the ruler as shown in Figure
1. Both probe tips should be at the 5 cm mark.7. Note that Data Collection has been set to Selected Events. After you begin data collection, each time you tap the KEEP icon, a set of data will be recorded for that location.
8. Move to the first location you planned to take measurements. Initiate data collection by tapping the Collect icon or pressing the Collect button. Position the meter stick so the temperature probe is shielded from the sun, the light sensor is pointed straight down, and the Infrared Thermometer is pointed straight down. Tap the KEEP icon to record your measurements. Do not stop data collection until you are finished with step 9.
9. Move to the next location, arrange your sensors, tap KEEP. Continue until you have collected data at all of the locations you planned. Then tap the Collect icon or button to stop data collection.
10. Go to the Data Table and record the data from six of your locations in the table below. Include descriptions of those locations from your sketch. The Infrared Thermometer reading is the surface temperature while the temperature probe recorded the 5-cm reading.
DATA
| Description |
Temperature (at surface) Co |
Temperature (at 5 cm) Co |
Temperature Difference Co |
Light Intensity lux |
| |
||||
PROCESSING THE DATA
1. In the space
provided in the data table, subtract to find the difference
between the temperature on the surface and the temperature 5 cm
above the surface at each location.
2. Which location had the greatest difference between its two temperatures? The smallest difference?
3. Give possible reasons for the results in Question 2.
4. Which location had the highest reflectivity? The lowest?
5. Give possible reasons for the results in Question 4.
6. Look at your reflectivity and temperature data. Do your results follow a pattern? Explain.
7. If you did this lab at a different time of day, would you expect similar results or differences? Explain.
8. If you did this lab at a different time of year, would you expect similar results or differences? Explain.
9. Connect your LabQuest 2 to a computer using the USB-mini cable. Launch Logger Pro software. Logger Pro should discover the LabQuest and its data and ask you if you wish to upload it. Your answers should be “Yes” and “OK”.
10. If the computer is connected to the Internet, you can export it to Google Maps. Go to File > Export As > Google Map… Zoom in or out as needed to display the data you collected. You may wish to go to Satellite View so you see the buildings as recorded by Google. Prepare a short presentation for your instructor, answering questions 2-6 above citing specific data from the Google map.
Click here to download a Word version of this lab
Click here to download a pdf version of this lab
This lab was adapted by C. Bakken from Experiment 8 in Middle School Science with Vernier for use in an on-site workshop.
June 2013