Objectives
- Analyze the behavior of pH as one dilutes an acidic solution
- Analyze the behavior of % Transmission of light as one dilutes a solution
- Compare the two behaviors to arrive at further understanding of the two quantities
Materials
- Vernier data collection system
- Stock solution
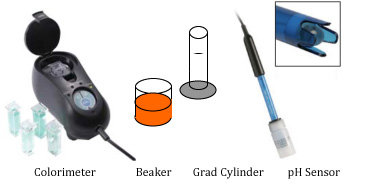
- Colorimeter
- Beaker – 150 mL
- Stir rod
- Graduated Cylinder – 50 mL
- pH Sensor
- Cuvette
Preliminary questions
1. If you are given a solution and test it to be pH 4, this is considered to bea. Acidic
b. Neutral
c. Basic
2. If the solution is then diluted by adding water, the condition in the solution will become
3. You are given a solution and your tests show that it transmits 60% of the light that strikes it. If the solution is then diluted, the transmission of lighta. More acidic d. Less basic
b. Less acidic e. No change
c. Move basic
a. increases perhaps to 70%
b. decreases perhaps to 50%
c. doesn’t change
Procedure
- Connect the pH Sensor and the Colorimeter to the interface and launch the data collection software. Calibrate the Colorimeter.
- Change the data collection mode to Events w/ Entry. The entry name will be “Concentration” and the units will be “%”.
- Obtain a 100-mL sample of stock solution in the beaker.
- Pour a small amount from the beaker into a cuvette until it is 0.75 full. Place the cuvette in the Colorimeter. (Be sure to wipe any spill on the side of the cuvette off so you don’t contaminate the Colorimeter.)
- Pour 50.0 mL of the sample into the graduated cylinder, leaving about 50 mL in the beaker.
- Rinse and dry the pH sensor bulb, then place the sensor in the remaining liquid in the beaker.
- Begin data collection. When the readings are steady, click on KEEP. When asked, the concentration will be “100%”. Do not stop data collection at this point.
- Empty the rest of the beaker into the WASTE and rinse the beaker. Pour the contents of the graduated cylinder into the beaker and then add an additional 50.0 mL of distilled water. Stir the contents to mix well. The concentration will now be half of what it was before. Rinse and dry the cuvette.
- Follow steps 4-8, each time diluting the solution by half (50%, 25%, 12.5%, 6.25%, etc.). After 6 dilutions, stop data collection. Rinse and dry your cuvette, beaker and graduate cylinder and return materials to their designated locations. Move on to Analysis.
Analysis
- Were the answers you gave in the preliminary section upheld during the lab? Explain any discrepancies that arose.
- You should have 2 graphs on the screen, pH and % Transmission. Focus on the graph of % Transmission first.
- How does the transmission of light through your sample change as the concentration changes? (During the lab you reduced the concentration but the graph reverses that pattern) Is there a mathematical relationship between the two? Test your thinking by doing a curve fit for % Transmission vs. Concentration. Report your results. Does this relationship make sense to you? Explain.
- Observe the graph to pH vs. Concentration. Describe the graph. Is it the same shape as your % Transmission graph? If the pH increases, what does this say about the acidity of the sample, or if it decreases, what does that mean? Describe in words the affect on the acidity of your sample produced by diluting it.
- What would happen to the pH if you continued diluting the solution a very large number of times?
- Use the curve fitting capability in Logger Pro to determine the mathematical relationship between pH and concentration. By definition, pH involves logarithms, so you may wish to model the graph using a log function. Report your best result and interpret the results.
* The data collection system could be LabPro, LabQuest Mini, or 2 Go! Links with a computer running Logger Pro or a LabQuest by itself or a TI graphing calculator and appropriate interface. You need 2 analog inputs to carry out the lab as described.
TEACHER NOTE
In this lab, the author envisions using a mildly acidic solution including some yellow food coloring. Dilution will reduce the concentration of yellow as well as diluting the acid. Variations can be made using different colors, basic solutions or different acids. Finally, one could use absorption rather than transmission in this study, yielding a different mathematical relationship from that obtained with transmission.This lab was suggested by a participant in an on-site workshop the author conducted in 2010. It was reviewed by a chemist and deemed to have merit. If you use this lab, please forward your results and other feedback to the author for fine tuning. Thank you!
Click here to download a computer version in Word format
Click here to download a computer version in pdf format
Click here to download a LabQuest version in Word format
Click here to download a LabQuest version in pdf format
C.Bakken
January 2011