 Graph Matching
Graph Matching
Graph Matching
In the Graph Matching area, we will post graphs that were obtained on a number of the rides at California's Great America. The graphs may be of the forces felt while on the ride or the altitude vs time graph that represents what the ride looks like if it were in a straight line. Different rides have unique sets of graphs depending on the nature of the ride.
A participation stamp will be given to all participants who score a minimum number of corrct matches. Note that some graphs may be portions of a ride rather than the entire ride. Read the axes carefully. Answer sheets are available at the Graph Matching booth. A set of clues to help analyze the graphs is linked here.
Grades 9-12: During PSM Days 2019, we will be rolling out a new Graph Matching activity for high school students. Specific information will be asked for that can be observed on the graphs or calculated from the numerical values on the graphs. Some knowledge of the rides ahead of time will be helpful, but the questions can be answered successfully without having to actually go on any specific rides.
Grades 6-8: During 2018 we are rolling out an option for students in grades 6-8. In this case, they will be answering questions about various places on the ride. Each group may be given a different ride or rides to answer.
Grades K-5: A modification has been made for K-5 students. Instead of trying to match specific rides, students will be asked to identify the type of ride involved. We now incorporate this mode full time. See the third Sample Graph below.
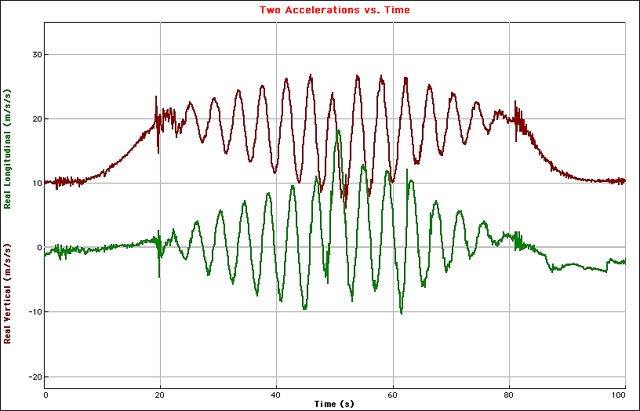
The following are examples of possible graphs and answer sheets:Sample graph (left) and sample answer sheet (right) for high school level
Sample Graph - 9-12
Sample Answer
Graph H (click to enlarge)
The time it takes for this ride to repeat, also called the period, is most closely
____ A. 1 second
____ B. 2 seconds
____ C. 4 seconds
____ D. 10 seconds
____ E. 20 seconds
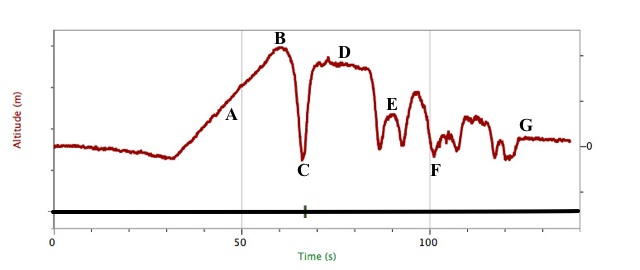
Sample graph (left) and sample answer sheet (right) for middle school level.
Sample Graph - 6-8
Sample Answer Sheet
Graph C
1. Highest Point _____
2. Fastest Point _____
3. Lift Hill __A__
4. Unloading Station ______
(Only one answer shown)
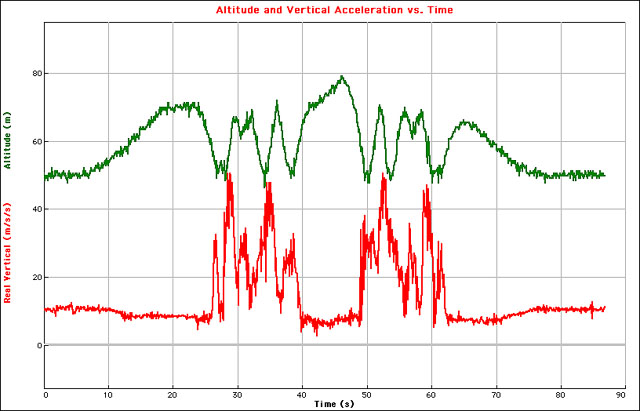
Sample graph and answer sheet for elementary level
Sample Graph K-5
Sample Answer Sheet
Graph D
____ B
____ C
_1__ D
____ E
____ F
____ G
____ H
- Roller Coaster
Demon, Patriot,
Grizzly, etc.
- Circular Ride
Centrifuge, Orbit,
etc.
- Drop Ride
Drop Tower,
Whitewater Falls
- Other
Rip Roaring Rapids,
etc.
Completed answer forms must be checked at the EDC before 2:00.
Location: Celebration Plaza
Hours: 10:00-2:00 (may be open earlier)
Page of hints
Click here for Teacher Note
Updated 3/12/2019