Lab Apparatus
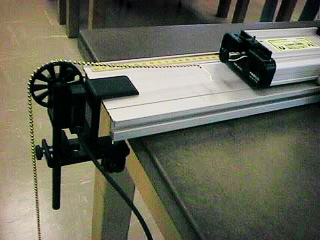
The source of the non-uniform acceleration is a chain (the type you
attach to lamps or ceiling fans). I imagine you could use other things
so long as it causes an non-uniform force. This chain is attached
to a dynamics cart (pasco variety) but you could also use other cars with
or without track. The chain is carefully positioned into the groove
of the smart pulley (pasco
or Vernier; check out vernier's latest smart pulley: cheap
and cool!!) and attached with simple string to the cart.
You could use a different pulley mechanism and substitute a motion
detector for the smart pulley, but
I thought the smart pulley interface was the
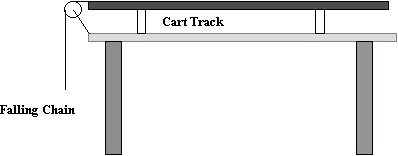
most simple. You set up the chain so that there is enough chain over
the pulley to begin pulling the cart. As more of the chain begins
to fall, more force is being applied to the cart while less mass is being
pulled. This creates a non-uniform force acting on the cart, which
results in a non-uniform acceleration. Ideally, you want to begin
taking data as soon as the cart begins to move and you want to stop collecting
data as soon as the cart hits the pulley or the chain hits the floor.
Your data at the very beginning and at the end will be erroneous so I suggest
you use science workshop to delete this data. .
The set-up above uses a smart pulley to measure linear position and time, from which velocity and acceleration can be calculated. (You can also measure jerk if you want to introduce the 3rd derivative of a distance vs. time graph)
Instead of a smart pulley, a motion detector could be used to also measure position and time. The chain and track set up is the same.
If you wanted to be very fancy, (and if you have the right boxes) you
could try using both the smart pulley
and the motion detector. This would
be very cool. Perhaps DEMO material.?!
Computer Set-Up
I used PASCO's Science Workshop but you could also use
Vernier's Logger Pro
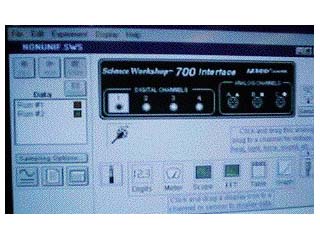
If you are using science workshop, you need to set up the program
so that the smart pulley is loaded into a
digital channel. You will also need to load both a graph and a table
into the same channel.
After imputing the graph into the digital impute, you will need to specify the variable from a list of variables offered by the program. You will need 3 graphs, d/t; v/t; and a/t. It doesn't matter which one you pick first, however, you will need to add the other 2 after setting up the program.
After imputing the table into the digital impute, you will need to specify
the variable from a list of variables offered by the program. I would
recommend that you set-up a table that includes time, distance, velocity
and acceleration. It doesn't matter what order you put them in, but
I would recommend the same order your students have been imputing them
in previous labs.
HINTS....PROBLEMS TO AVOID...Things I learned the hard way
To get very good results, you need to alter the sampling speed. I believe science workshop is pre-set to take data with a frequency of 20 Hz. When you are installing the sensor, table and graph, take a moment to also change the sampling speed which is also found on this screen on the lower left side of the screen. You must make this change at the very beginning otherwise the program will not accept changes and require that you exit the program and reinstall everything.
Last Updated 7/24/97
Comments and Suggestions are always welcome: